
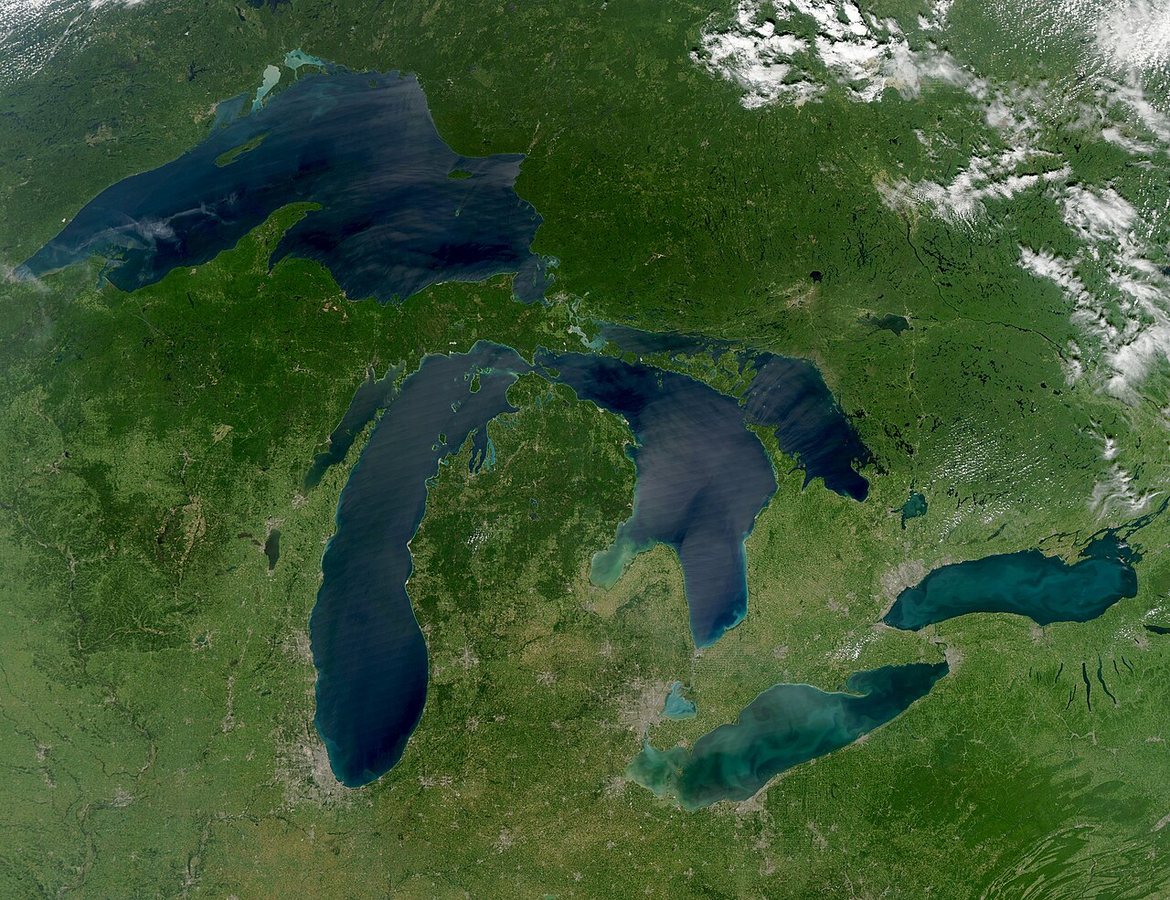
Machine-learning algorithms can predict water levels in the Great Lakes with errors as small as a dozen centimetres and, more importantly, can explain which climate factors drive those changes, according to a study published in the journal Science of the Total Environment. The research, based on 40 years of monthly data, offers a new way to anticipate the dramatic swings that have battered shorelines, harbours and coastal wetlands across the region.
The stakes are visible in the recent record. Lake Michigan hit its lowest level on record in January 2013. Seven years later, in the summer of 2020, it set the opposite record, with widespread flooding, eroded shorelines and closed lakeside roads. The gap between the two extremes was nearly two metres. Lakes Superior, Erie and Ontario underwent similar reversals within months of each other, and almost no one saw the shifts coming. Water levels govern harbour depths, shoreline stability, drinking water intakes and the survival of coastal wetlands, making accurate forecasts a persistent challenge in hydrology.
Traditional hydrologic accounting treats a lake like a bank account, adding rain, runoff and upstream inflows while subtracting evaporation and outflows. The method is rigorous but demands extensive calibration and struggles with unusual climate variations. Machine learning takes the opposite approach, feeding decades of data into an algorithm that identifies patterns and corrects itself when estimates deviate from measurements. The trade-off has been that the results come with no explanation, limiting their usefulness for managing a dam or mapping a flood zone.
To close that gap, the researchers trained eight algorithms on monthly water levels for Lakes Superior, Michigan, Erie and Ontario from 1982 to 2022. Each algorithm incorporated nine variables, including air temperature and inflow rates, supplied for the current month and for one to six months earlier. That design allowed the model to connect June water levels to January snowfall. For the four best-performing algorithms, the error fell to roughly a dozen centimetres, compared with 14 to 21 centimetres for the simplest models.
The team then made the models account for their results using SHapley Additive exPlanations, or SHAP, a technique from game theory that distributes a team's payoff among its players. Applied here, it quantifies how much each variable contributed to a given month's rise or fall in water level, answering whether air temperatures or inflow rates matter more. Because SHAP cannot show how long a signal takes to travel across a watershed, the researchers added variogram analysis of response surfaces, or VARS. Instead of merely observing the model, they interfered with it, for example by increasing runoff as an early snowmelt would, and measured the impact one month and six months later.
The four lakes behaved differently. Lakes Superior and Michigan are large, slow-moving basins fed by snowmelt, so their levels depend on runoff and outflow. Shallow Lake Erie depends on inflow from upstream via the Detroit River. Lake Ontario stands out for the significant influence of evaporation. Applying the same method and variables produced four distinct results reflecting those characteristics.
The most striking finding concerned timing. The researchers expected the influence of variables to fade further back in time, much as a downpour's effect disappears from a river after a few days. The opposite occurred: influence increased after three or four months. A lake does not react to yesterday's weather but to the previous season's, the study concludes. That inertia is good news for seasonal forecasting, because part of what will determine next summer's water level has already fallen as snow.
One lake defied the algorithms. Lake Ontario produced errors more than 50 per cent higher than expected, a failure the researchers attribute to human decisions. Its levels are regulated at the Moses-Saunders Power Dam near Cornwall, Ontario, under operating rules adjusted day to day. Because each variable in the model is summarized by a single monthly value, the sequence of decisions behind the dam's outflow is lost in the average. When more water is released to protect downstream residents even though climate conditions did not require it, the model sees a drop in water level with no identifiable cause among its variables. It learns poorly and makes more mistakes.
The fix, the researchers say, is straightforward: provide those operating rules to the model just as rain and snow data are provided, so algorithms stop drawing conclusions from erroneous data. The approach also extends beyond the Great Lakes to other surface waters where climate and collective decisions interact.
9